


Why Web Animation
There are several reasons, though they all boil down to one simple statement - Web animations really matter.
So to kick things off, let's start talking about storytelling. Let's go back, back in time, people were sharing stories with books. In the late 19th century a new era of storytelling arrived by making films. This different way of storytelling brings together people who previously were reading books and people who didn't enjoy them and maybe find them boring. So this captured more viewers' attention because basically it's all about motion pictures. By showing a series of moving images and sound into the audience.
Well, the point here is that by telling stories in a different way by combining visual effects and soundtracks dictates the right mood and atmosphere. And gives the audience an unforgettable experience. Animations are super powerful and why not just use them to do awesome crazy stuff on the web.
Our brains understand motion and trained to track moving objects. Things that are changing instantly is more confusing and does not feel natural. You might not even realize what has changed. A change should come in progress.
Onboarding is one of the best places where you can make most use of animation because animation is the best way to guide users. For instance, say you are creating a site-specific onboarding flow for selling pre-owned cars. You can onboard users in a way that when they answer and jump to next question, different types of cars go across the screen like a slideshow giving them the illusion that cars move from left to right. this is just a very basic example. There are great surprising ideas.
Css animation
Css animation is the simplest and most performant way to do animation on the web. And it does not involve writing any Javascript at all. This actually has a cost of being limited and not be able to create complex physics effects out of the box but most often it's just all what you need.
Performance
Yes animation really matters but it could be a double-edged sword. If you are not gonna do it right, you should rather not do it.
Browser Rendering Pipeline
Well, to be able to measure your animation performance you have to understand the browser rendering pipeline. At every visual change, the pipeline gets triggered to update the screen.
The pipeline consists of five essential parts; Javascript, Style, Layout, Paint and Composite.
-
JavaScript: This part that gets triggered every time a visual change happens. We call this a task and it happens when a user adds a class name to an element or when (s)he tries to animate an element using either a library or nativaly.
-
Style: The process constructs what is called the render tree, technically, it figures out which CSS rules apply to which elements. For example
.ob-blogorsection > img. And then the styles applied for each element is calculated. The render tree only includes elements that have a form of visual appearance by dropping script and head elements as well as those elements that havedisplay: none. And even if some elements that don't live in the dom like pseudo elements end up in the render tree. -
Layout: The process where the browser calculates the geometry of elements telling how much space each element would take and where it's positioned on the screen. Because elements can affect each other, this process can be quite heavy and costly especially on low powered mobile devices. For example a random element's width would affect all its child and ancestor elements' width all the way down and up the tree. And how far that goes, depends on the browser and layout boundaries.
-
Paint: The previous process in the pipeline results in geometric shapes or vectors. So essentially this process takes those vector shapes and filling in pixels using what is called a rasterizer:
technically this rasterizer creates a list of draw calls(if you are familiar with drawing shapes in HTML5 Canvas, it's kind of similar), and then filing in pixels by executing the draw calls.
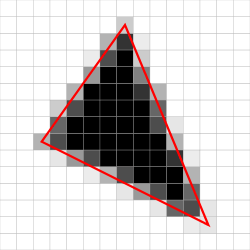
Chrome applies a trick used in gaming to enable smaller and faster screen repaints by grouping the pixels into tiles. The browser only repaints the tile where the change happens instead of repainting the whole window:
As I scroll you see the areas that needed to be updated highlighted in flashing green. The pale green vertical lines you see on the GIF represent the tiles the paint is splitted into.
In more general terms, Paint is just an operation where the browser repaints the elements like colors images and texts, or every visual part of an element like borders and shadows.
- Composting: After the paint is finished it results in multiple painted layers, so this operation assembles those individual layers into a final screen image making sure composited layers are rendered on top of each other in the correct order considering Html elements' order and
z-index.
Measure your Animation Performance
Without the proper measurement you would not know what is wrong. You need to spend time and effort measuring by using the tools that help us diagnose the areas where animations not performing well and might feel janky.
On a 60Hz display, which is of course the most common, the available time to render a single frame is 1000ms / 60fps which is around 16ms. Well this means in order to achieve silky-smooth animation you have to keep all the work under this period of time. But actually this period gets even narrower than this because the browser already has some housekeeping work to do at every frame. So you have between 10 to 12 milliseconds left to get everything done. And if you fail to meet this budget, the framerate would drop and you would see what is called Jank which is really bad for user experience.
The changes we make in JavaScript won't necessarily trigger every part of the pipeline:
1: JavaScript > Style > Paint > Compositing: When we do not change the geometry of any element and we only change paint-only properties like colors, images and border colors -- the affected parts of the pipeline are JavaScript, Style, Paint and Compositing. And as you can see we have skipped Layout.
2: JavaScript > Style > Compositing: When we change compositor-only properties like transforms and opacity. Obviously this version is considered the cheapest because the browser jumps to the layer management process(compositing) directly skipping both Layout and Paint. This version is more encouraged and best for web animations.
Chrome Dev Tools' Performance Panel
Chrome dev tools' performance panel is a great place where you can both measure and spot performance bottlenecks. And literally every single work is visualized to the user. I created a small rotating Obytes Logo using css transforms:
Measuring
I have recorded the animation performance of the rotating Obytes logo. And here is what I got:
FPS: The area outlined in red is called the FPS chart, and what you should know is that the higher and narrower the green bars the higher the FPS and the better of course. And whenever you see a red bar right on top of the frame it means the framerate drops and the green bar appears short and wide. This is a sign for a performance hit somewhere in the code.
CPU:
Right below the FPS chart there is the CPU chart. The blue area is a graph of all the work done by the browser including Scripting, loading, Rendering and painting and other internal works. Here you have to avoid maxed out work for a long period. Here usually you would see the yellow color dominating the whole chart if you are not optimizing your JavaScript code.
To better understand the relation between CPU and FPS charts, I have recorded the animation when clicking on a movie tile in Netflix:
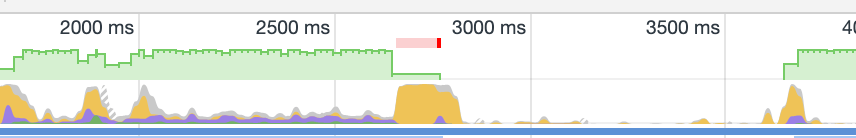
Well on the screenshot it appears that after clicking on the movie tile, a new task has been added to the main thread. And on the CPU chart it looks like as the yellow color is maxed out(meaning that JavaScript is being processed by the browser), the framerates kind of drop and took longer time as indicated by the short and wide green bar and the red bar above it.
Screenshots: At each single frame a screenshot of the page is captured and by moving the mouse right and left over the screenshots area or above you would be able to see a replay of the animation recording. See the area outlined in green.
Spot Bottlenecks
The next step after measurement is to know exactly why is your animation lagging, but first you need to select a portion in the recorded animation by either zooming in/out in Main section or clicking, holding and dragging anywhere in the FPS, CPU or Screenshots charts. Also you can select a task or a frame by clicking on a green bar in the Main Section's Frames dropdown field at the top. Or just clicking on a task in the Main section.
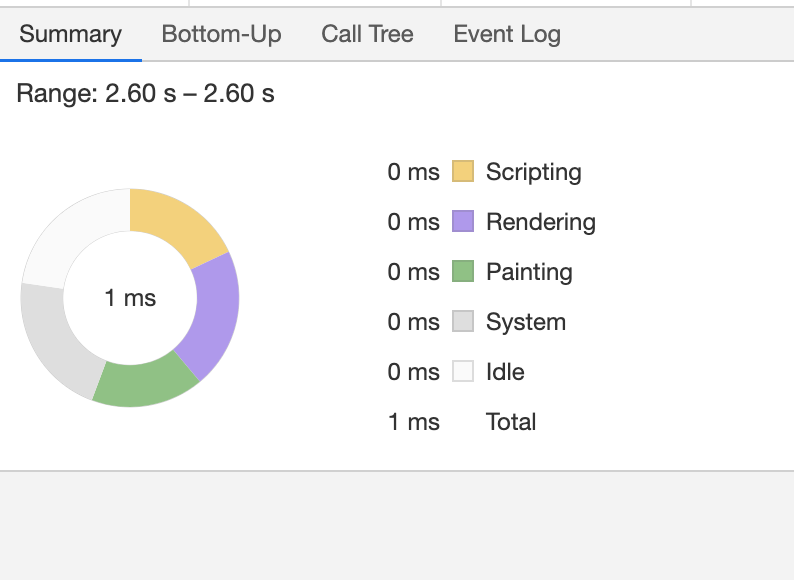
Summary: The Summary pane gives us insights of the percentage of time each work in the selected portion has taken. If the purple is dominating the whole circle it's clearly a good change that you are causing the browser to unnecessarily calculate style and doing extra Layout work.
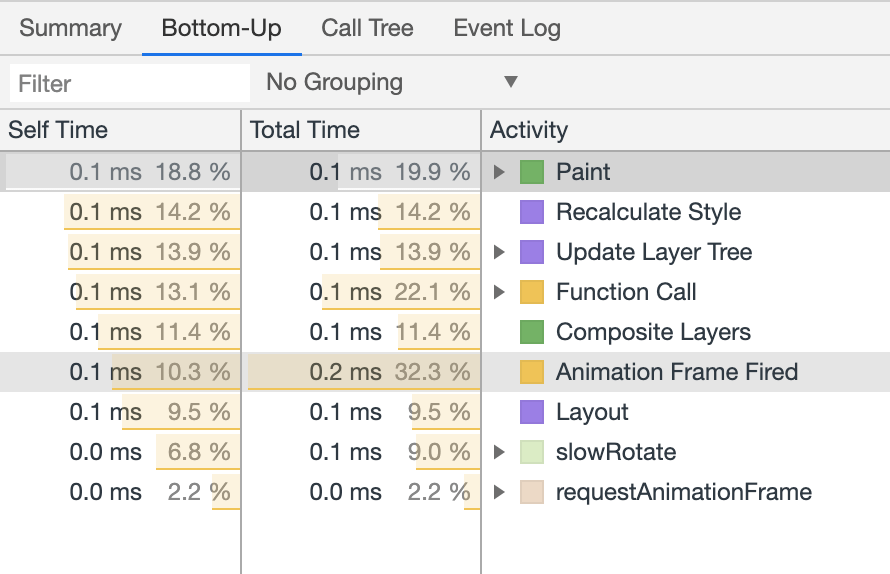
Bottom Up: Helps us spot the most expensive activities in the selected portion of the recorded animation. Well it's a bottom up list and by default the tasks that take up the most self time appear at the top. A task's total time is the sum of that task's Self Time and its child task' total time.
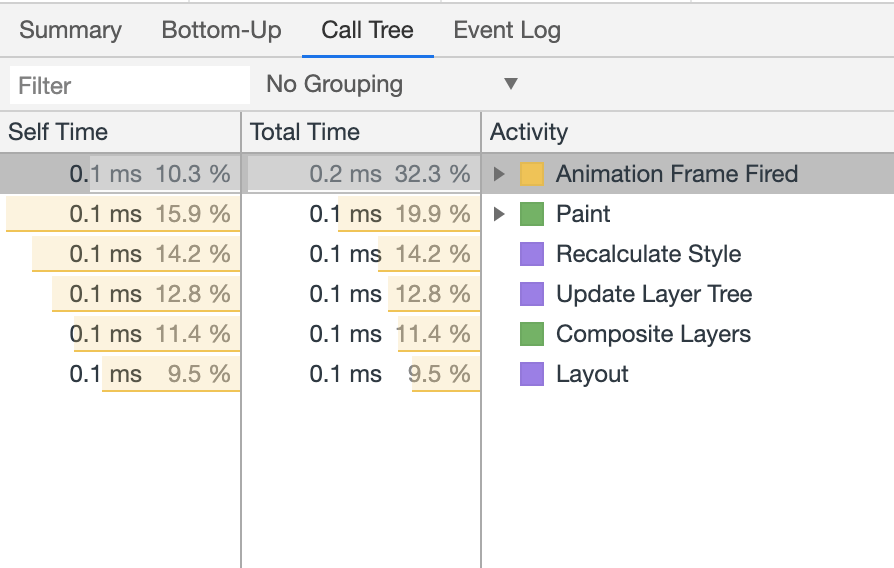
Call Tree: Used to record all root activities browser spent the most time in.
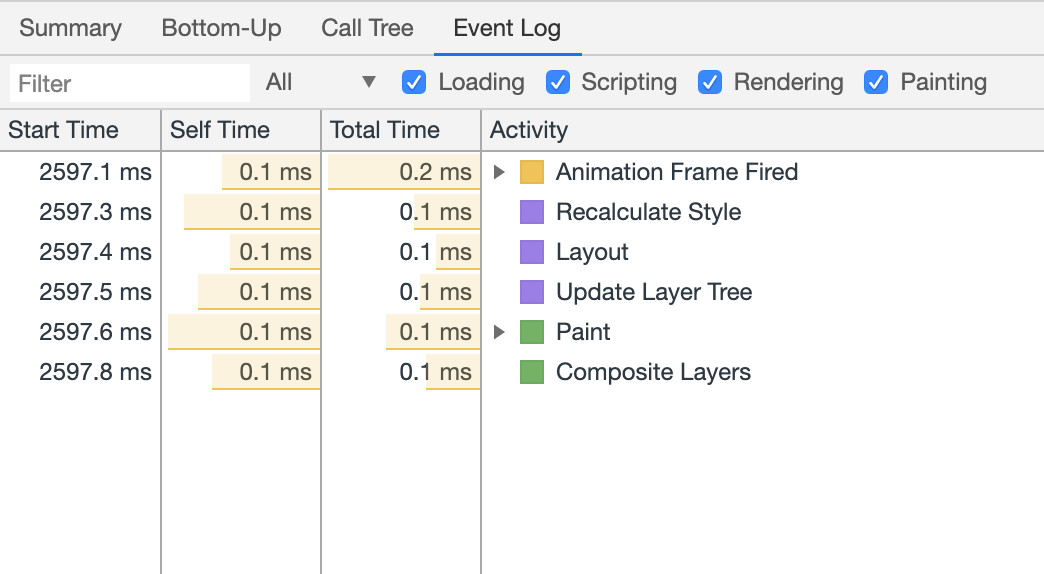
Event Log: Used to record all the events during the selected portion in the same order they were occurred.
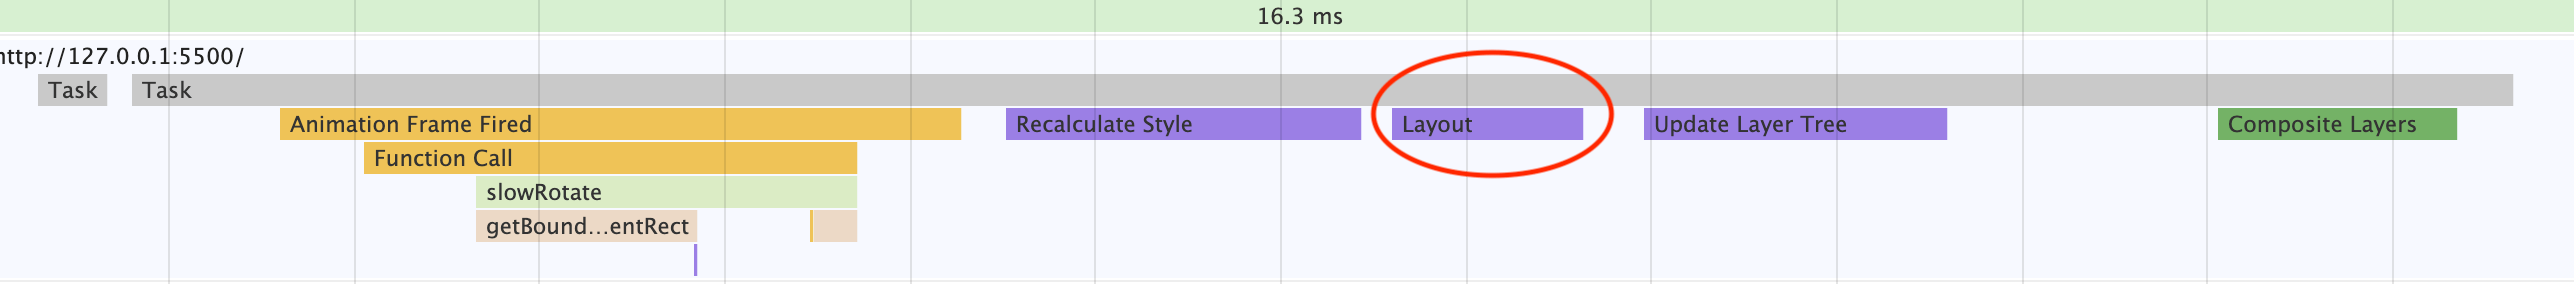
The Main Section: It's the area outlined in pink in figure The recording of Obytes logo. And it shows all the events that have been fired by the user or the browser in the recorded portion. The x-axis represents the time and y-axis represents the call stack. The bars represent the events. I have taken a screenshot of a single frame in the rotating Obytes logo animation recording:
As you can see, an animation frame task is being processed by the main thread and here what it does:
- animationFrame fired
- animationFrame executes the callback
- the callback executes rotate
- rotate calls two other functions in a row: getBoundingClientRect and requestAnimationFrame
- And finally the browser triggers the rendering pipeline.
As you might notice above the main thread is blocking and only one single task is being processed at a time. The browser API is what gives you the illusion of asynchronous programming. The call stack will not be always readable especially when using libraries. And what you end up seeing is a deep call stack of micro tasks.
requestAnimationFrame
Traditionally web animation frameworks used to animate stuff using setTimeout which is not made for animation at first place. setTimeout is a browser web API that defers execution of a callback function by a number of milliseconds. That callback function is first handled by the browser outside the main thread. After waiting for that amount of milliseconds, it gets scheduled in the task queue later to be executed.
Let's suppose that this callback function causes a visual change:
function animate() {
  rotateByOneDegreeForFrame();
  setTimeout(animate, 1000 / 60);
}
We are here specifying 1000 / 60 to match the most common refresh rate. But in reality 60FPS is really hard to be achieved using setTimeout because the number of milliseconds we specify, is the interval between when the setTimeout first gets executed and when the callback function is added in the task queue. Then the callback has to wait until it gets its turn, and it's not guaranteed how much time each task in the queue would take. As a result, updating the animation will be drifted out causing the screen to not update in a frame and duplicated work to be done next frame.
requestAnimationFrame on the other hand happens as part of the rendering pipeline. When using this Browser API, you are asking the browser for a new frame. And it only calls the callback when the browser is ready to perform next repaint. No matter what the screen refresh rate is, requestAnimationFrame will synchronize itself with the display. And only update up to a frequency the display is capable of. Finally, requestAnimationFrame improves battery life because it does not update the screen if the target element is not visible.
Avoiding Layout/Reflow
One uncommon thing about Layout events is that they have scope. When you change something in the DOM by adding/removing elements or changing their positions, this will almost always cause the entire document to reflow (the scope here is the entire document). And the larger the DOM, the longer the period of time spent re-calculating. Say you have an Element A, and you tried to make this element grow in size in a period of a second. And let's suppose that this element has a parent element B and child elements C, D and F. The browser must re-calculate the parent element B, and all child elements to give them the correct sizes. So here the scope that the browser needs to re-calculate is the dom tree from element B down to C, D and F. The problem with browsers is that each time you trigger layout by changing an element's size or position the whole document reflows, meaning the browser needs to calculate all the DOM nodes in the current page. Meaning the scope the entire document. With Layout boundaries with can shrink this the scope down into a smaller one. Meaning less time re-calculating and less CPU powesr.
When you are creating an animation, it's very important to make sure you only use CSS properties that does not trigger Layout like transforms and opacity. Let's take our previous example and change the Obytes Logo's position using left and top:
And then measure the animation performance. As you can see bellow. Obviously the animation is less smoother but even Layout events are triggered, the result looks fine though. And you might be wondering why the animation still performing just fine even when using CSS properties that trigger the Layout.

Well basically since Layout causes the whole document to reflow and unlike this example, the DOM has to be super large in a web application. So The process sometimes would take a long time and there would be no enough room for all the work to make the frames arrive on time. The render tree in this example is tiny.
We can't avoid Reflow in a case where you need more than just animating absolutely positioned elements. But we still can reduce their impact. Say you want to implement an expand and collapse animation for a grid's tiles, you need to use the height property which going to retrigger Layout. So one way to reduce the impact, is to avoid causing the document to reflow by putting Layout boundries. I am not gonna cover them in this post but I am leaving a great reference at the end of the article.
Avoiding Forced Synchronous Layouts
Maintaining the order of the pipeline is important because in some cases you cause the browser to trigger the pipeline in the wrong order. And one of those cases is when you try to perform animations based on previous layout values. And you end up doing something like this:
function worstAnimationSomeoneCanMake(timestamp) {
  const ObytesLogos = document.getElementsByClassName('obytes-forcedsync');
  const Wrapper = document.getElementsByClassName('wrapper')[0];
  const { width: size } = Wrapper.getBoundingClientRect();
  const radius = size / 2;

  for (let i = 0; i < ObytesLogos.length; i++) {
    const ObytesLogo = ObytesLogos[i];
    const { left, top } = getComputedStyle(ObytesLogo);
    const angle = ((ANGLE - i * 10 + timestamp / 9000) * Math.PI) / 180;

    ObytesLogo.style.left = `${parseFloat(left) + 17 * Math.cos(angle)}px`;
    ObytesLogo.style.top = `${parseFloat(top) + 17 * Math.sin(angle)}px`;

    ANGLE = ANGLE + 1;
  }

  requestAnimationFrame(worstAnimationSomeoneCanMake);
}
This is obviously the worst code someone could ever write. And I am sure no one would do this but it's a good example to illustrate the serious performance bottlenecks forced synchronous layouts can cause. For the browser to tell the current style left value, it must calculate it which requires running Layout. This causes calculating styles and Layout to run earlier inside JavaScript.
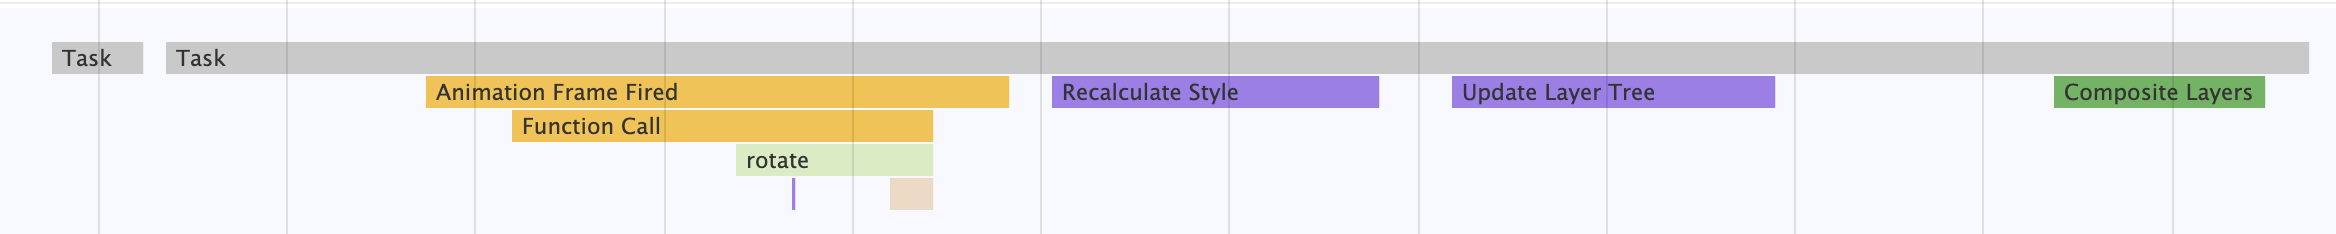
The previous animation results in this performance recording:
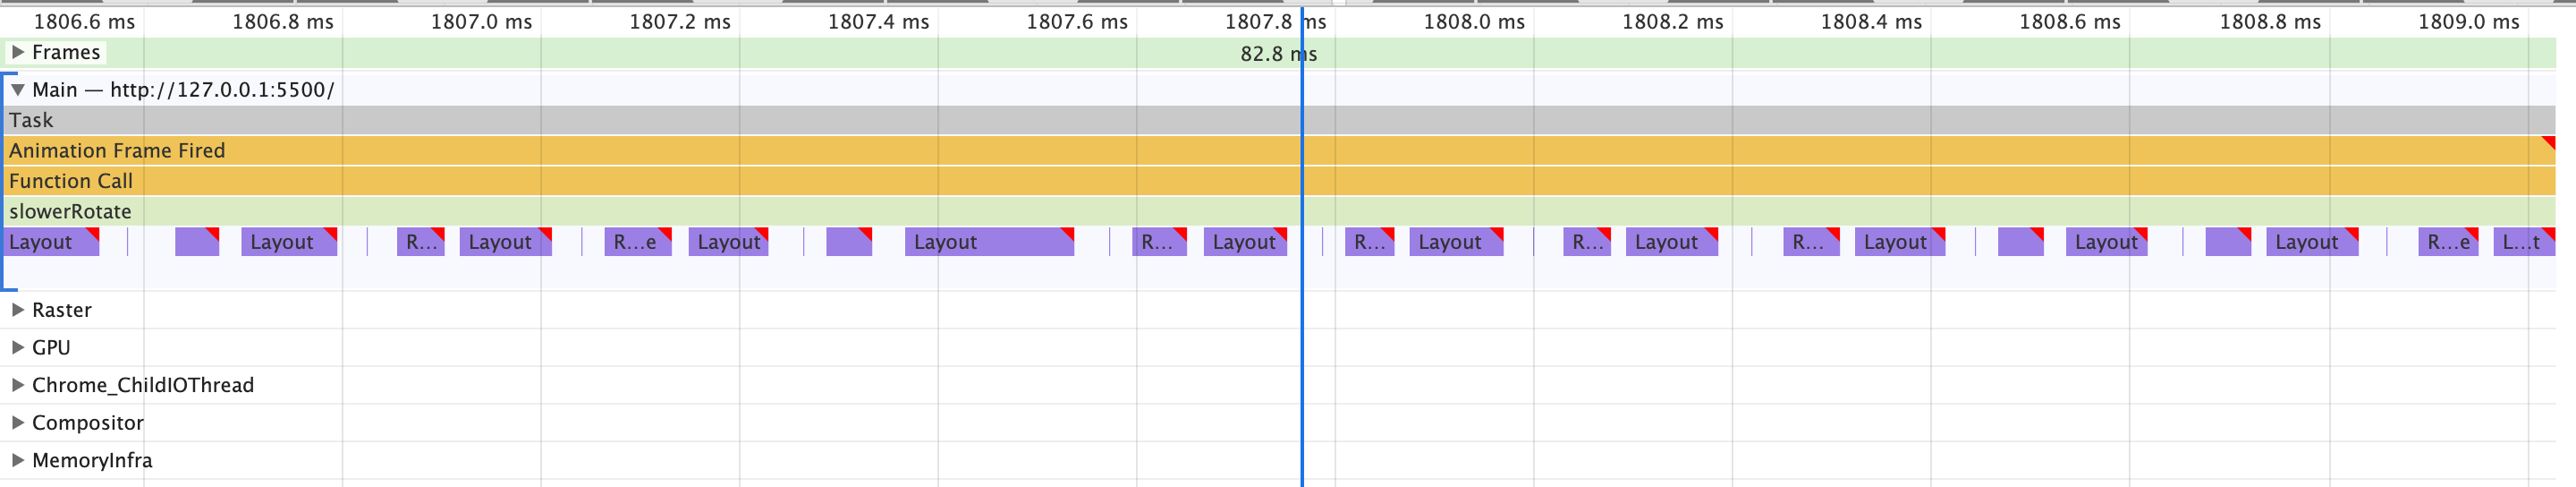
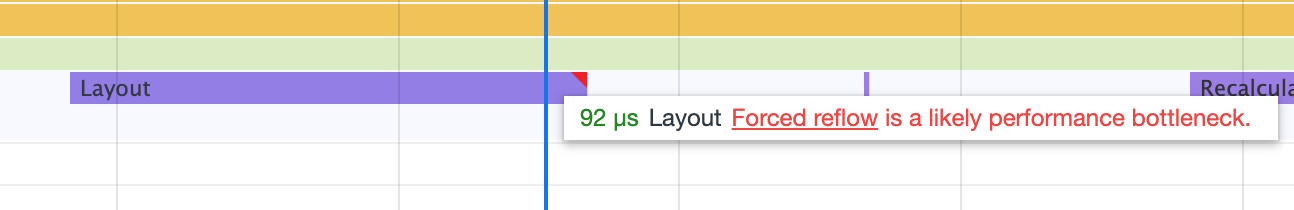
As you can see, under the Animation Frame Fired the callback is executed which in turn executes a function called slowRotate(it's worstAnimationSomeoneCanMake in the above code) and finally right below this one there are many little purple bars which indicates style calculation and layout events. There appears a little red triangle in the purple bars which denotes a forced synchronous layouts. And when we hover over a layout event you would see a Forced reflow(aka forced synchronous layouts) warning:
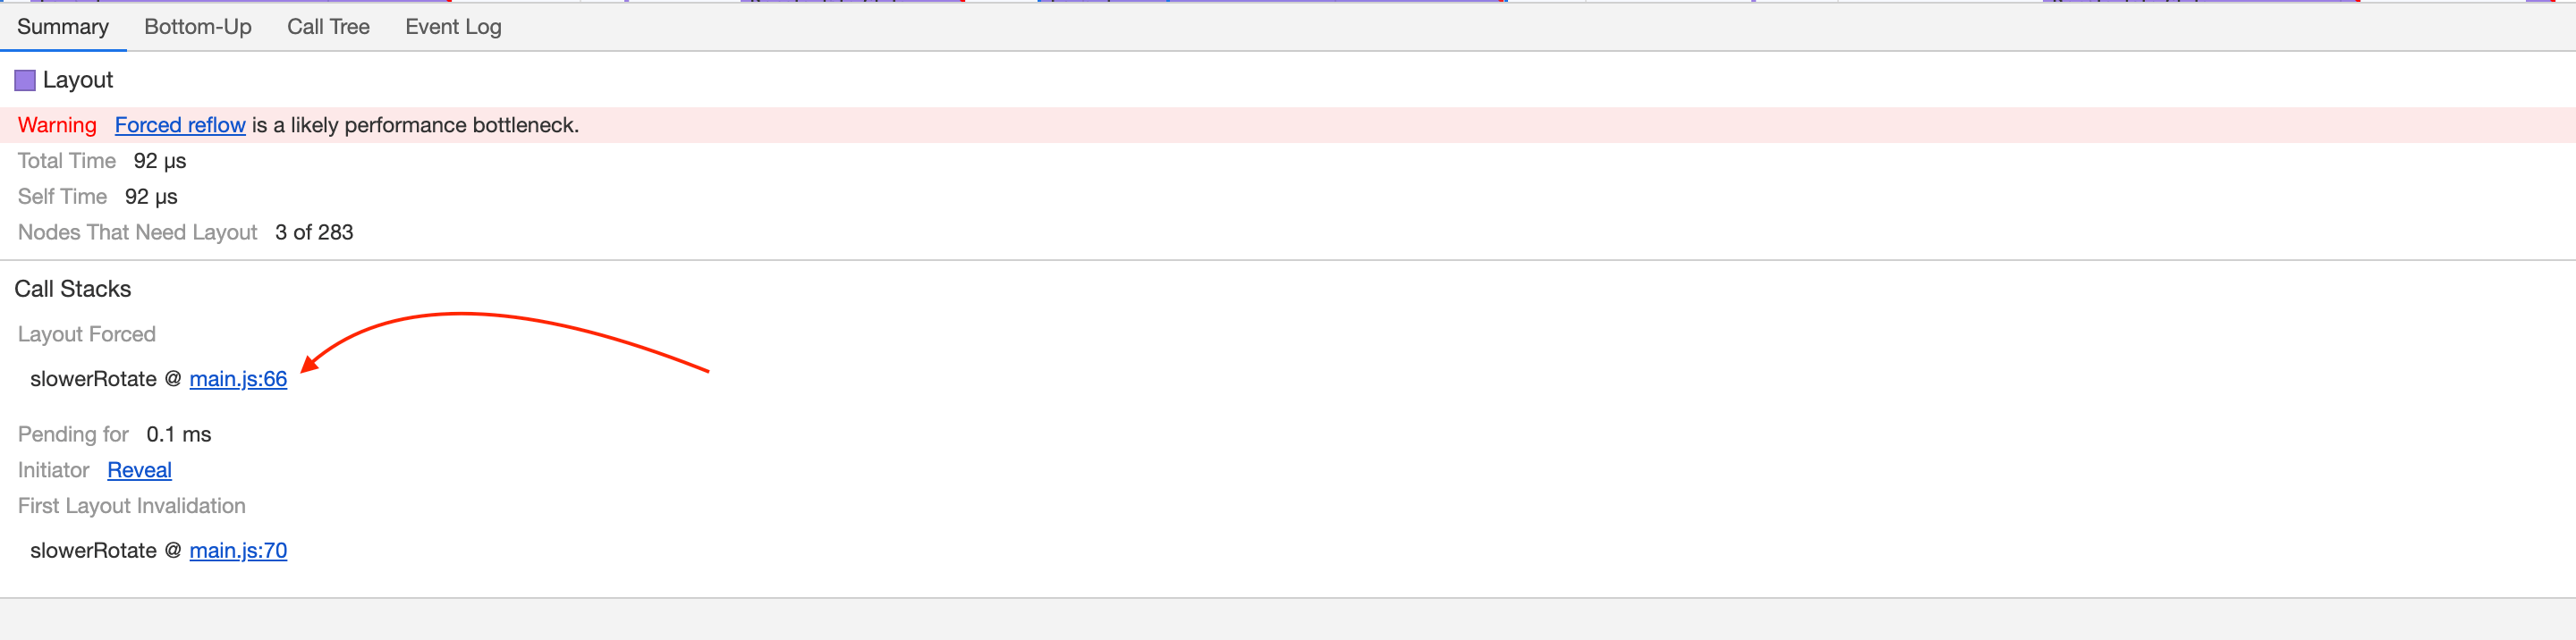
After clicking on one of the layout events, the Summary pane would reveal which part of the code causes forced synchronous layouts.
CSS will-change Property
Css will-change property can be helpful when making animation. This property informs the browser with which properties are about to change and the browser will prepare itself for appropriate optimizations ahead of time. will-change is an expensive operation because it requests the browser to generate a new layer. And since shipping more layers to the screens would affect performance it's better not to overuse this property.
Conclusion
Even though animations make our sites or apps come alive, they shouldn't be overused as they can be very annoying. And performance should be one of the developers core principles. And achieving 60FPS is one of them to make their users happy. It's challenging to achieve 60FPS in a complex animation using JavaScript though but it's still doable especially when you spend time and effort measuring and diagnosing performance problems.
Thank you for reading.
Other Resources
- Javascript Event loop by Jake Archibald
- Jank Busting for better rendering performance by Tom Wiltzius(maybe old article but it's still very useful)
- Introducing 'layout boundaries by Wilson Page
- Everything You Need to Know About the CSS will-change Property byt Sara Soueidan
- Get Started With Analyzing Runtime Performance by Kayce Basques
- Rendering Performance by Paul Lewis
- The future of web animation by Sarah Drasner