
This is the last article of a series of articles about monitoring.
-> First article: Monitoring CloudWatch key metrics using Slack and manage them using Terraform
-> Second article: APM using Datadog
-> Third article: Monitoring CodePipeline deployments
In the previous articles, we talked about monitoring CloudWatch key metrics, application performance monitoring and deployments. In this article, we are going to talk about monitoring external services used by our application or by our team.
Why should you monitor external services?
Almost every application depends at some point of external services. These services may have problems, which could impact our applications. Besides this, it's pretty annoying to look for a problem in your application and -typically hours- later, find out that it hadn't anything to do with your app!
By having alerts of external services status, we can quickly be aware of external problems and take countermeasures to reduce the impact of those in our application.
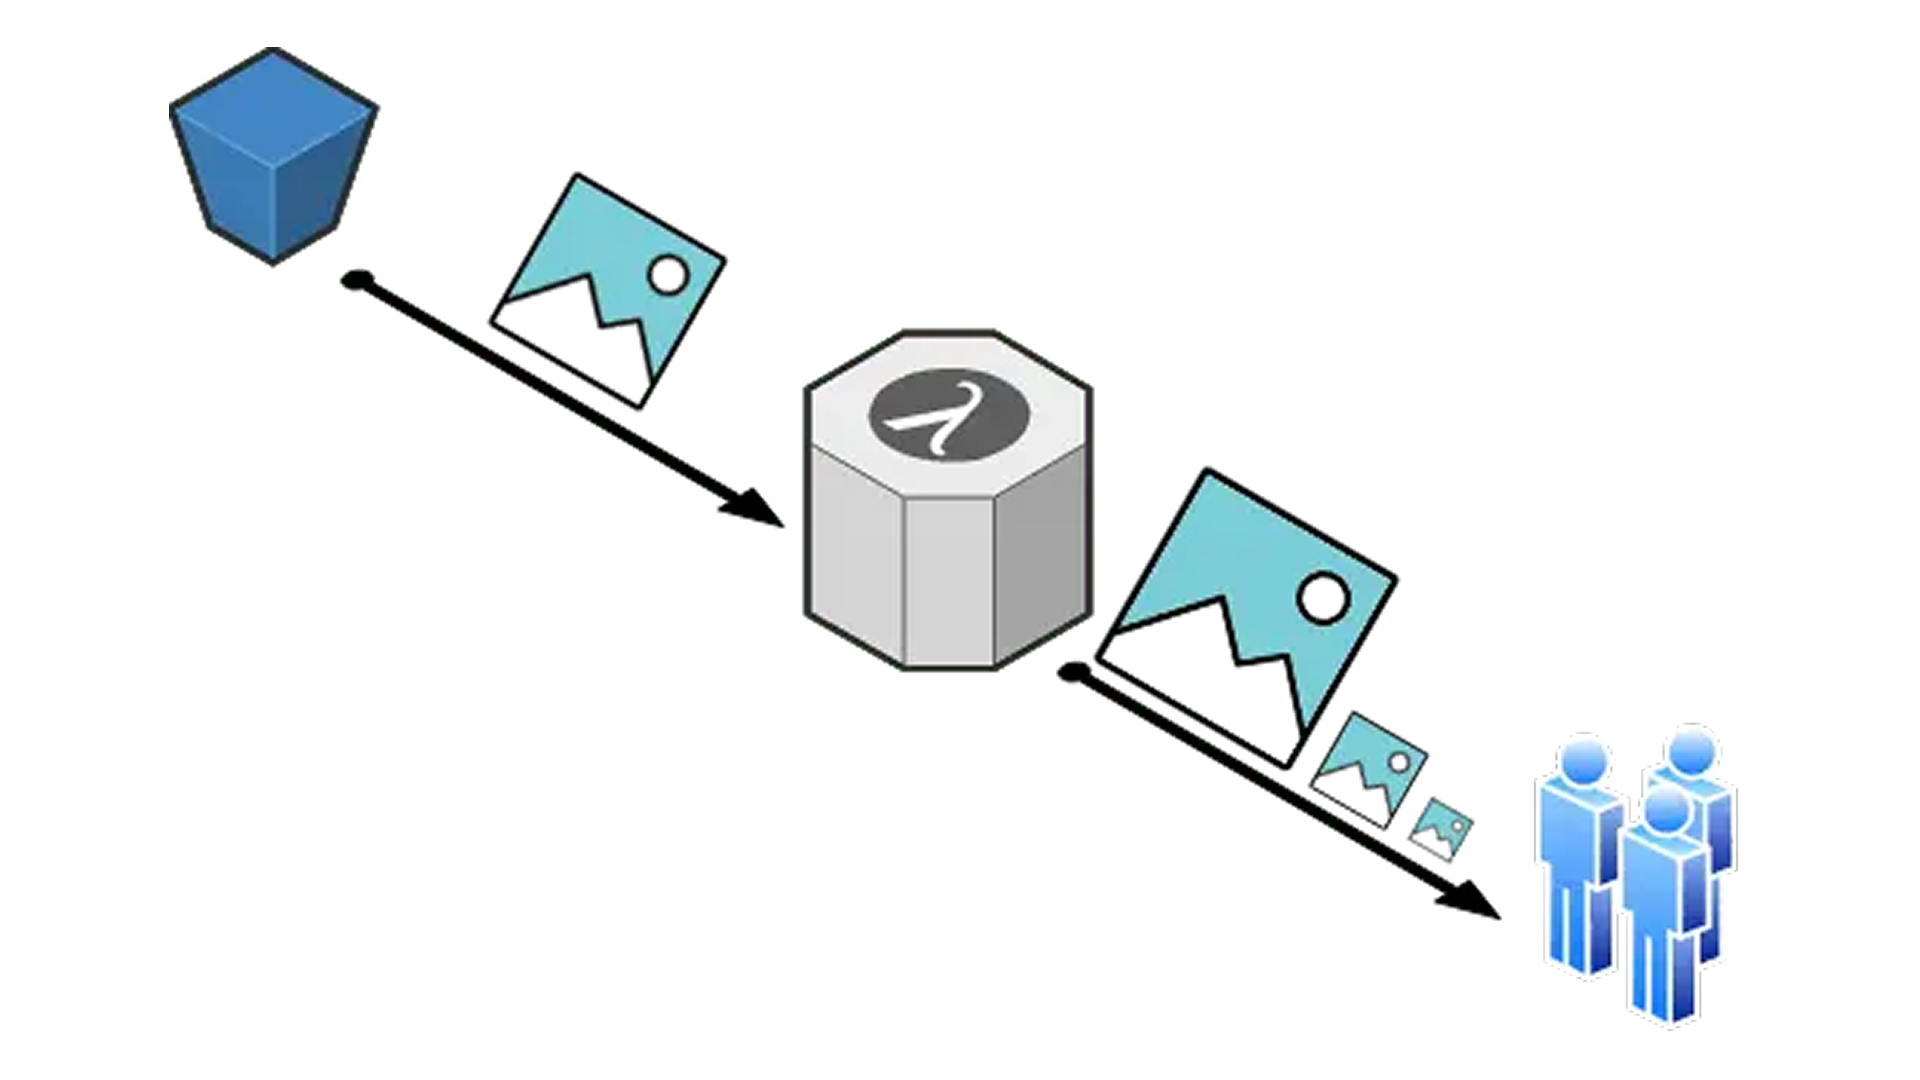
Sending status alerts to Slack from RSS feeds
To send external services status alerts to Slack, we are going to use the RSS Slack application.
This process is quite straightforward. First, you'll have to install this application in your Slack workspace. Then, go to a channel and type /feed subscribe <FEED>. That's all you need to start receiving feed updates. For more information, check this link.
AWS
Although Amazon Web Services is a very reliable service, it had suffered outages. In these cases, your application might be affected. So you want to be immediately alerted when AWS is down in order to make sure you limit the impact as much as possible.
AWS Global Status
AWS Service Health Dashboard is available at http://status.aws.amazon.com and provides access to current status and historical data about each and every Amazon Web Service. There's an RSS feed for every service to which you can subscribe to receive updates.
Another option to monitor AWS Global Status is to use Datadog Alerts along with AWS integration. This option gives you more control over the alerts you send, giving you the possibility to customize the messages, who should be notified...
AWS Personal Health Dashboard
AWS Personal Health Dashboard provides alerts and remediation guidance when AWS is experiencing events that may impact you. While the Service Health Dashboard displays the general status of AWS services, Personal Health Dashboard gives you a personalized view into the performance and availability of the AWS services underlying your AWS resources.
You can use Amazon CloudWatch Events to detect and react to changes in the status of AWS Personal Health Dashboard (AWS Health) events. So, we are going to use the same approach than in the previous article to leverage a new CloudWatch Event Rule that notifies an SNS topic that will invoke our Lambda function.
To make a rule that applies to all AWS services, for Event Type, choose All Events. If you choose all events, you cannot choose event type categories or event type codes.
Then, you need to configure the SNS topic as the target for this CloudWatch Event Rule.
We will use the same SNS topic and Lambda function than in the first article. You can find them in the source code of this article.
You’ll also need to create a Slack webhook and set it as an ENV variable for the Lambda function.
Datadog also offers monitors for AWS Health, which allows you to customize more AWS health alerts.
RSS feeds for external services
Although the list of external services you should monitor depends on your application, here is a list of some of the services that we are using (and their RSS status feeds) and probably your application is also using (at least any of them!).
- CloudFlare Status: https://www.cloudflarestatus.com/history.atom
- Datadog Status: https://status.datadoghq.com/history.rss
- DockerHub Status: https://status.docker.com/pages/533c6539221ae15e3f000031/rss
- GitHub Status: https://www.githubstatus.com/history.rss
- Hashicorp Status: https://status.hashicorp.com/history.rss
- PyPi Status: https://status.python.org/
- Sentry Status: https://status.sentry.io/history.rss
Thanks for reading!
This concludes our series of articles about monitoring. In the previous articles, we went through key metrics to monitor using CloudWatch, APM using Datadog and CodePipeline deployments monitoring. Finally, on this article we shown how to monitor external services used by our application/team.
If you have set up all the articles recommendations, your visibility over your application and infrastructure has increased from the beginning and you are able to anticipate and react to problems much quicker than before.