

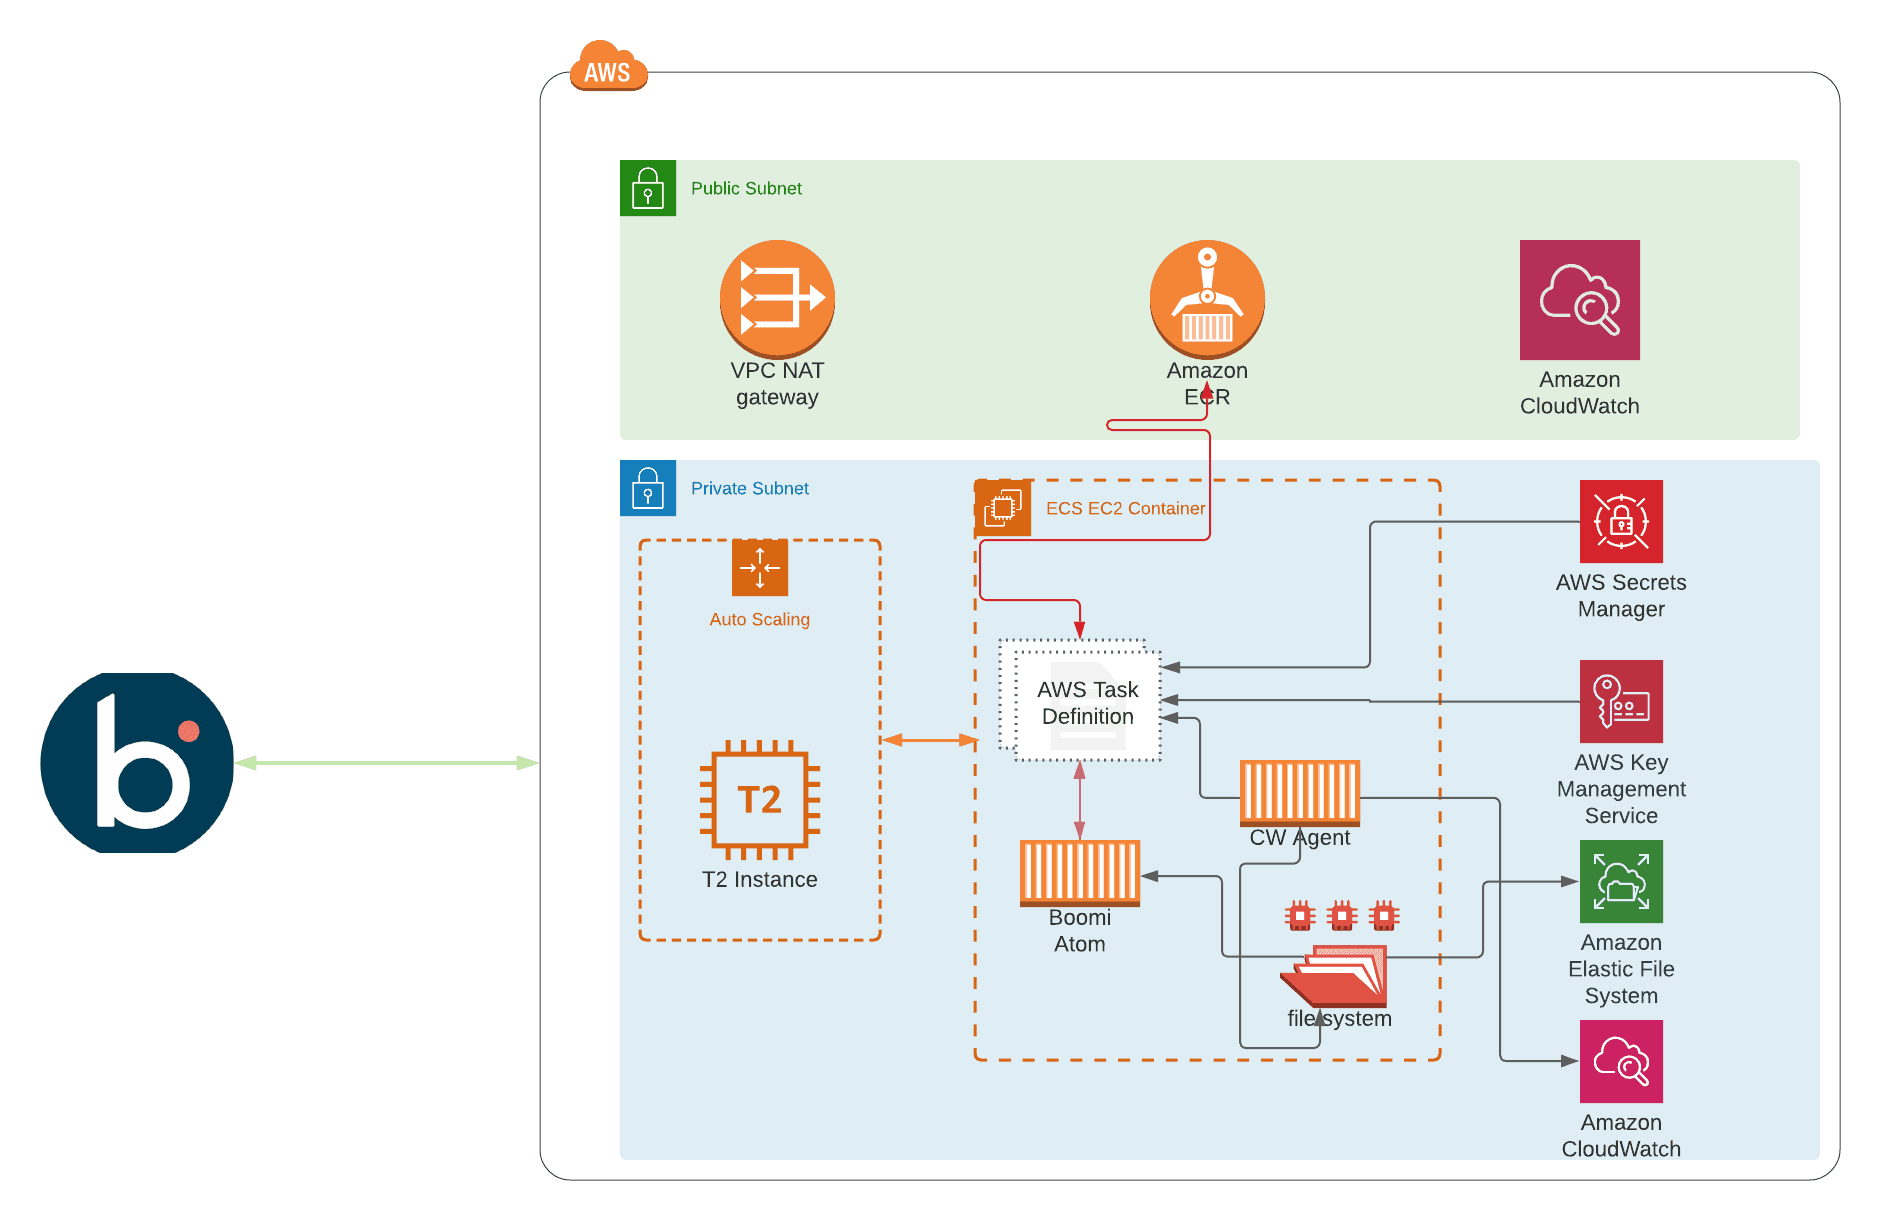
In this article, we are going to leverage on what we had built in Part 1 of this series and integrate the Atom container with AWS CloudWatch Agent, So I would encourage you to go through it to have a clearer view of the infrastructure. Our goal here is to push Boomi processes execution logs, plus the Atom logs, to CloudWatch for log collection and alerting via different channels. Here we will cover the alerting via Slack.
AWS CloudWatch Agent Installation
The first step is to install the AmazonCloudWatch Agent as a sidecar container; the sidecars are additional containers that run alongside the main one, they are usually used to perform peripheral tasks such as logging, configuration, or proxying requests, this will be deployed to the same ECS service built in our previous article, the container definition of the CWA could be found in the CloudWatch Agent Dockerfile in addition to the entrypoint which will copy all the required files by the CW Agent to run successfully, Our CWA config file can be found here, for more details or customization please refer to AWS Documentation, below are the main points about the CWA Installation
- Build the CWA image and push it to ECR, as shown in the below snippet.
The ECR repository used in the below example is the same one created in previous Part
docker build -t cw_agent:cwa -f CWA_Dockerfile .
aws ecr get-login-password --region <region_name> | docker login --username AWS --password-stdin <AWS_ACCOUNT_ID>.dkr.ecr.us-east-1.amazonaws.com
docker tag cw_agent:cwa <AWS_ACCOUNT_ID>.dkr.ecr.us-east-1.amazonaws.com/<ECR NAME>:cwa
docker push <AWS_ACCOUNT_ID>.dkr.ecr.us-east-1.amazonaws.com/<ECR NAME>:cwa
- By default, the CWA sidecar container image would be tagged with
cwaif no value provided tovar.cwa_tag, here is the complete ECS task definition for the CW Agent side-container.
.....
   "name": "${var.cloudwatch-container-name}",
   "image": "${var.repository_url}:${var.cwa_tag}",
   "entryPoint": [
     "sh", "entrypoint.sh"
   ],
.....
- CWA container will be using the same EFS mount points used by the Boomi Atom container; by leveraging this approach, the CWA will have access to the Atom and process execution logs.
- CWA configuration file is a JSON file that would be generated by executing the
terraformplan and storing it on AWS SecretsManger.
resource "aws_secretsmanager_secret_version" "config-file" {
 secret_id = aws_secretsmanager_secret.cloudwatch-config-file.id
 secret_string = templatefile(join("/", [local.templates, "config.json"]), { for key, value in local.cw_agent_config : key => value })
}
- CWA entrypoint script will copy the config file from the SecretsManger to the Cloudwatch Agent installation folder.
    aws secretsmanager get-secret-value --secret-id ${CONFIG_FILE_SECRET_ID} --query SecretString \
   --output text > /opt/aws/amazon-cloudwatch-agent/bin/default_linux_config.json
Boomi Process Logging
Next, we will switch to Dell Boomi Platform to understand how the logging is working; But before doing so, let's take a look first at what Boomi Event Framework offers us and how we can leverage it.
Boomi Event Framework captures Events from processes and Atoms within your account and records them in the platform database, which later would be consumed by either Email, RSS, Atmosphere API, or the Process Execution UI. By default, these logs are not being written to any Atom logs unless we use the Notify shape with User Log enabled, for more information about the Atom Logs locations and description kindly refer to AtomSphere Logs, one more thing I need to highlight here is that, the default installation folder for Boomi Atom is /var/boomi/Atom_ and this is controlled by an environment variable INSTALLATION_DIRECTORY, for more information about the env vars available for Atom installation please refer to boomi/atom Dockerhub, our CW Agent configuration file specifies the path of the log file to upload to CloudWatch Logs as /var/boomi/Atom_ecs_mol/logs/**.log where ecs_mol is the Atom containers' name, for a complete config JSON file please check CloudWatch Agent Config, following is a snippet of file_path configuration.
"logs": {
   "logs_collected": {
     "files": {
       "collect_list": [
         {
           "file_path": "/var/boomi/Atom_ecs_mol/logs/**.log"}
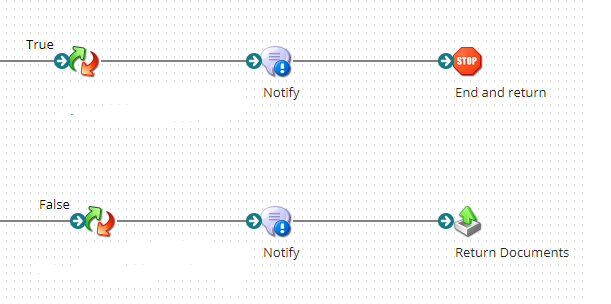
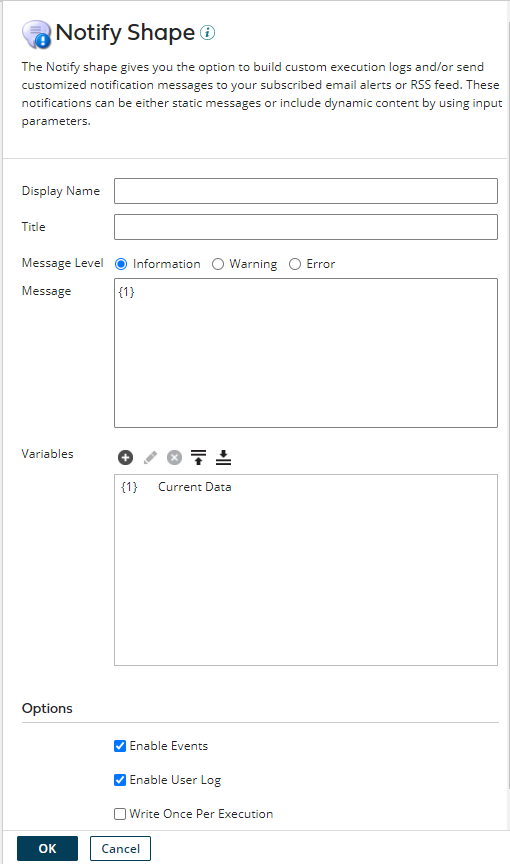
Next, let's add a Notify Shape to our process with Enable User Log is checked, this would write the data generated by the previous shape to the process logs that will be sent to the log groups configured in the CW Agent.
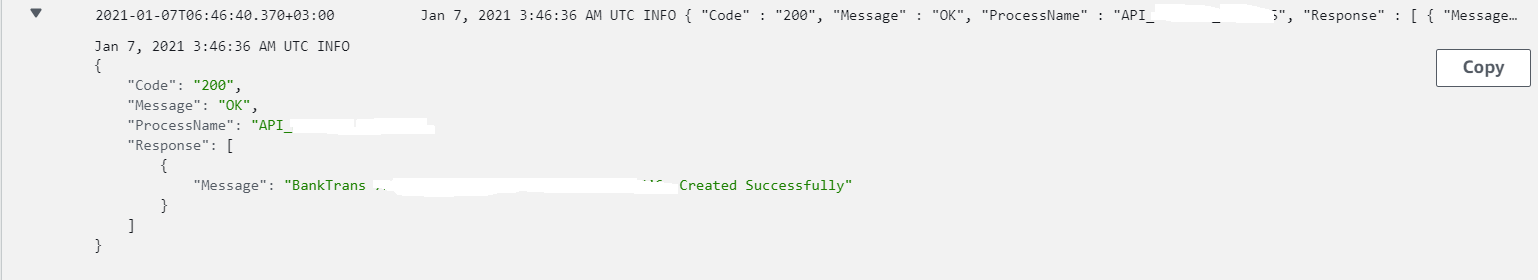
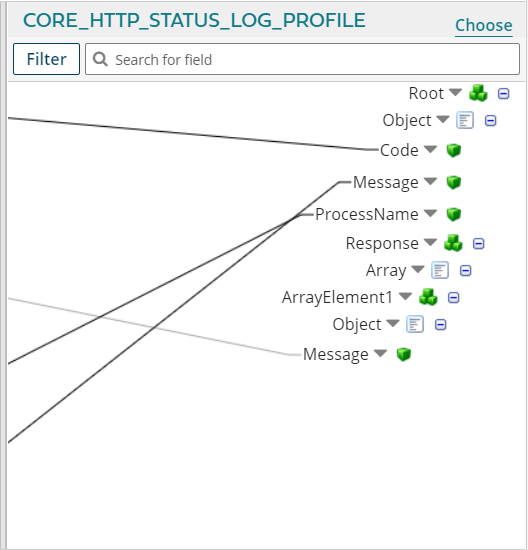
Once the process execution completed, we can see the logs on AWS CloudWatch, as shown below.
Note: The type of
Codekey is Number, as this would help us while configuring the CW metric filter to be filtered by numeric values, as we will see in the next sections
CloudWatch Metric and Slack Alerting
As shown in the last picture, the collected logs from the Boomi process is a JSON file. This is not the default behavior; but our Data Map shape is configured to send the logs to Notify Shape as a JSON log, below is an example of the generated log structure by the Data Map , the idea behind that is to take advantage of the metric's filter for AWS CloudWatch Logs and build a filter pattern based on Keys such as Error Number or Process Name, below is an example to build a metric filter if the Error value is 400 and above, for more information about the filter syntax of log events, please check Filter and Pattern Syntax.
resource "aws_cloudwatch_log_metric_filter" "boomi_metric_filter_error_401" {
 log_group_name = aws_cloudwatch_log_group.boomi_log_files.name
 name = "${aws_cloudwatch_log_group.boomi_log_files.name}-filter"
 pattern = "{$.Code >= 400}"
 metric_transformation {
   name = "ErrorGreaterThan400"
   namespace = "BOOMI_METRIC"
   value = "1"
   default_value = "0"
 }
}
Besides this, we will implement a metric to send any alarms generated by the above filter to the SNS channel, whose in return would be fanned-out to Slack by leveraging the AWS Chatbot's feature, as we will see in the next section.
    resource "aws_cloudwatch_metric_alarm" "boomi_metric_alarm_http_401" {
 alarm_name = "${local.prefix}-boomi-http-400"
 comparison_operator = "GreaterThanThreshold"
 evaluation_periods = 1
 metric_name = aws_cloudwatch_log_metric_filter.boomi_metric_filter_error_401.metric_transformation[0].name
 namespace = "BOOMI_METRIC"
 period = 60
 statistic = "Average"
 threshold = 0
 datapoints_to_alarm = 1
 alarm_description = "Alarm to be triggered if the number of HTTP_401 is greater than 0 for the last minute"
 treat_missing_data = "missing"
 alarm_actions = [aws_sns_topic.cloudwatch_alarms.arn]
 tags = local.common_tags
}
AWS Chatot Integration
In this article, we are not going to discuss the AWS Chatbot creation instead, we will refer to our blog entry for Sending notifications to Slack using AWS Chatbot. Our module in terraform-aws-ecs-boomi is configured with an optional AWS Chatbot module that is controlled by the variable var.is_chatbot_enabled which is defaulted to false. here we will configure the boolean variable var.chatbot_is_enabled to True.
Unfortunately, there is one pre-requisite step for the Chatbot module where we have to create the client manually via AWS console and configure a new Slack client, as shown in the below picture.
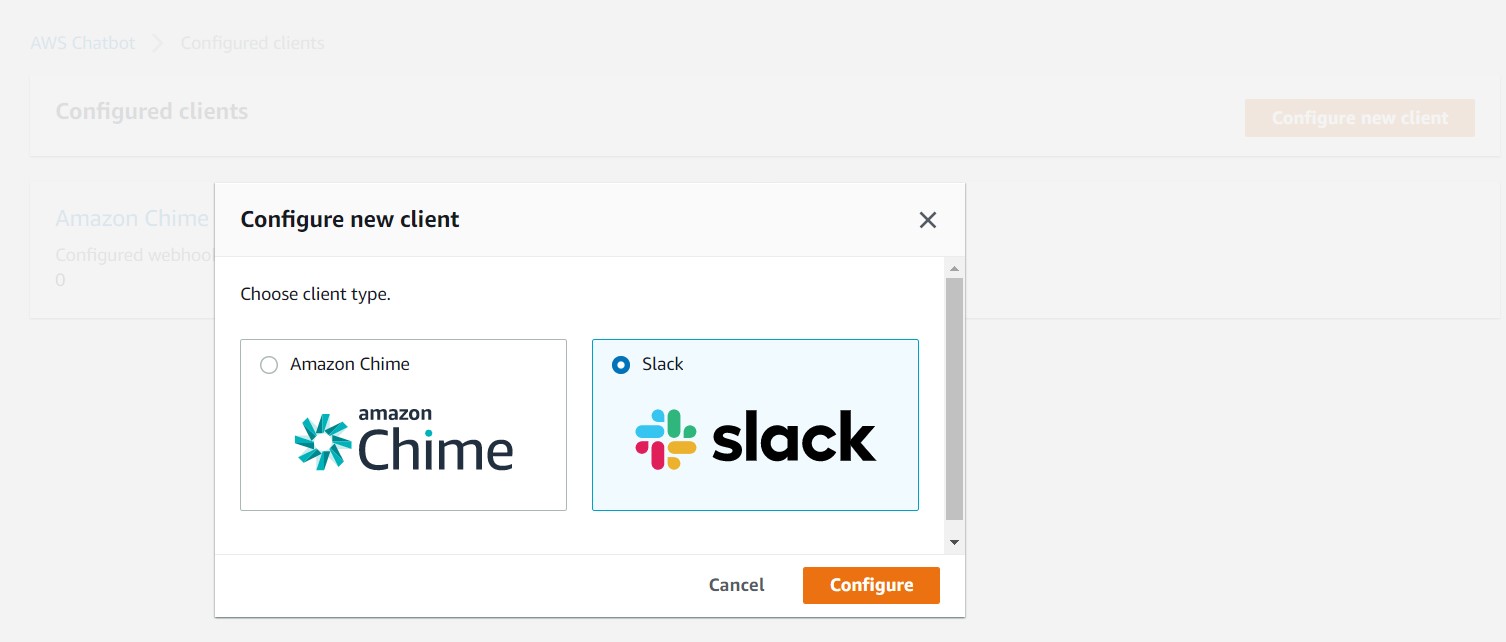
Once the client is configured and chatbot_is_enabled turned on. Our module creates the required Chatbot configuration and associates it with the provided Slack workspace, channel IDs and would listen to the SNS topic created above.
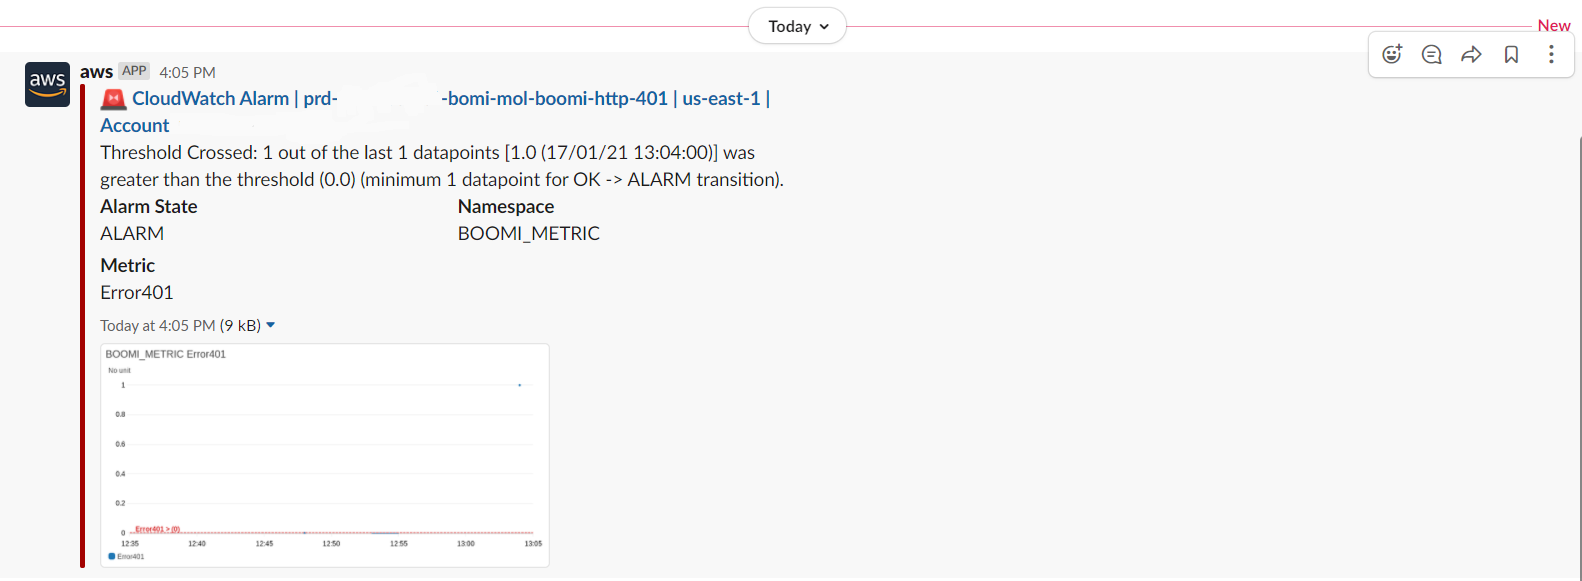
Below is an example of how the CW alarm would look like when received on the Slack channel.
Conclusion
I hope you find this article useful and informative for you and I do appreciate your comments if you faced any issues while deploying this, or you have any improvements, enhancements you are welcome to submit a PR to terraform-aws-ecs-boomi